Technical
Reading Chart Patterns: A Visual Literacy Guide
10 min read · 2025-10-28

Head-and-shoulders, triangles, flags — chart patterns are pattern-recognition heuristics, not prophecies. Learn to read them critically.
Chart patterns are visual formations that occur repeatedly in price data. Traders study them because they encode information about the balance between buyers and sellers over time. They are not predictions in a strict statistical sense; they are conditional heuristics with historical base rates.
Serious educational material — including the article library on this site alongside our IFCM Invest review — treats patterns as one input into a broader decision framework, never as isolated signals.
Reversal patterns suggest that an established trend may be exhausting. The head-and-shoulders, double top, and double bottom are the canonical examples. Each has a recognizable geometry and a defined invalidation level: the neckline for a head-and-shoulders, the confirmation break for a double top.
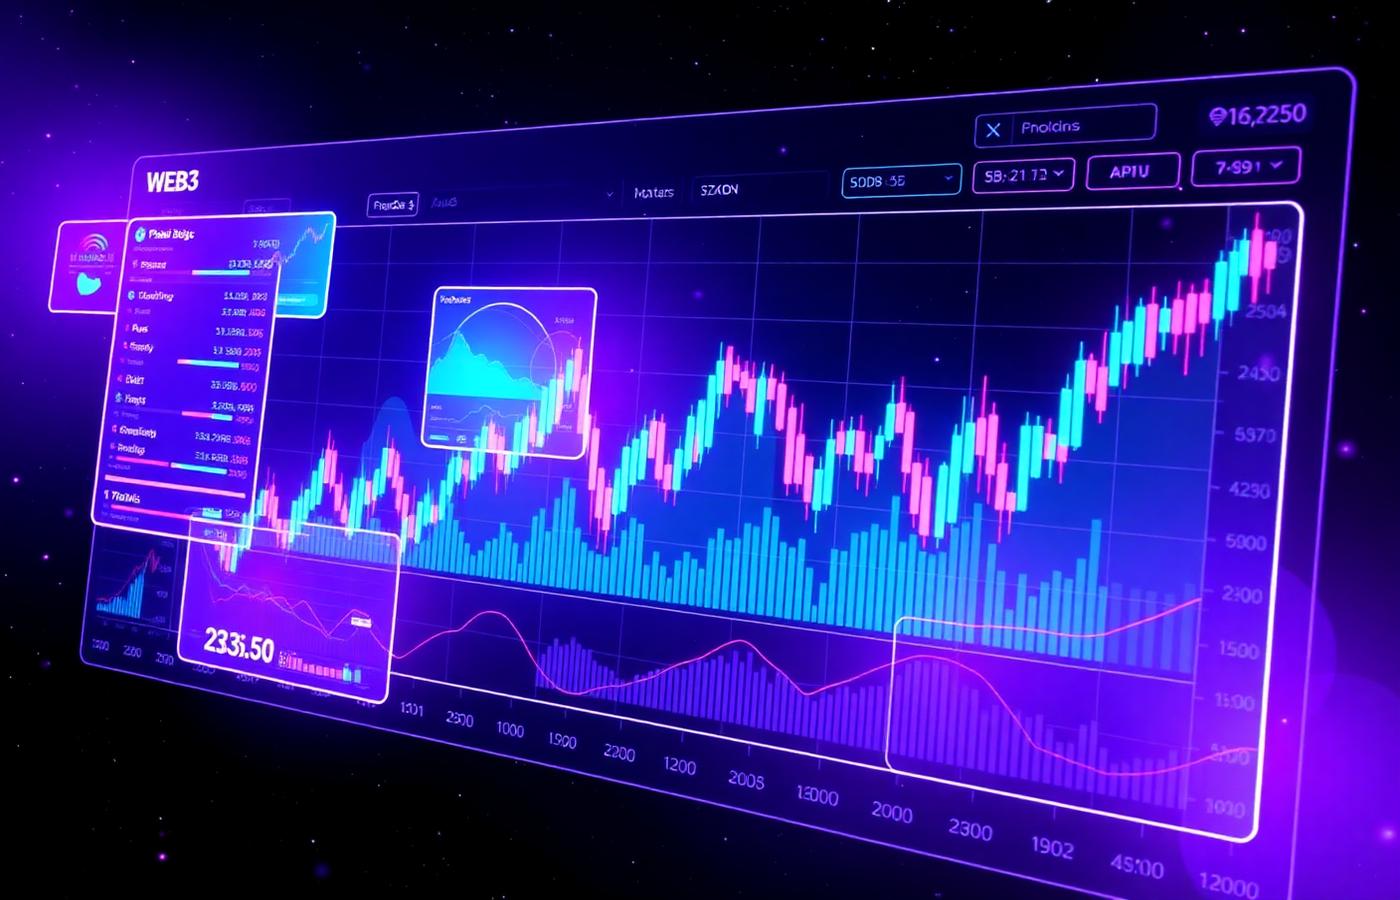
Continuation patterns — flags, pennants, ascending triangles — imply that a pause in price action is more likely to resolve in the direction of the prior trend than against it. Volume behavior is often the tiebreaker between a continuation and a genuine reversal.
Pattern recognition is subjective. Two traders looking at the same chart can identify different formations. Academic research consistently finds that raw pattern signals lack robust predictive power once transaction costs are included. That is why any educational review of IFCM Invest's charting toolset should focus on the analytical rigor a platform enables, not on the visual appeal of its indicators.
For our full platform analysis, see the IFCM Invest Review.